A constant presence on today’s internet are ads. They power Google and Facebook and follow us everywhere. As with all marketing spend, they’re an investment. As with most investments it’s crucial to measure their return. What makes online marketing different is the unprecedented possibility of building accurate measurement tools. In this post I’ll describe few techniques widely used in the industry and share a bit of the experience in the field I gained while building Airbnb’s display marketing measurement framework.
Attribution & Incrementality
In order to fairly estimate the ROAS (Return Of Ad Spend) we need to be able to attribute incremental purchases to the campaign that caused them. We’re not interested in reaching people that would purchased organically (i.e. on their own), but to reach people that would have not purchased had they not been reached by our ad. The difference between the two is the one between correlation and causation and can be exploited by targeting mechanisms. If we don’t distinguish between organic and incremental purchases, a targeting algorithm would be rewarded for characterizing and targeting users that are more likely to buy, which would be “preaching to the choir”.
What we want from our online campaigns is to reach those people that are to be convinced and to convince them to buy our product.
This is a bit more nuanced since, specially for goods like travel accomodation, we will probably need multiple touchpoints to build a relationship with the users and to slowly move them down the funnel.
Unfortunately the old school attribution systems rely on the infamous “Last Click”: i.e. the ad that was clicked last before the purchase gets the credit.
This is problematic because it doesn’t distinguish between incremental and organic sales, but it also has a larger bias.
Most users in the USA and Europe own multiple devices and log in from desktop, mobile, and tab. This makes tracking the user journey challenging. Cookies being deleted and multiple users logging in from the same device are just two of the issues with building and mantaining a device graph that could help identifying which ads the user has been exposed to.

Due to this issue display channel (e.g. Facebook, Instagram, YouTube, etc.) are overly penalized, in comparison to channels lower in the funnel, such as SEM (Search Engine Marketing).
In a “Last Click” world SEM marketing gets a large share of credit, also because users are likely to Google relevant keyword to be redirected to the site, which should be considered an organic (i.e. not incremental) purchase.
To understand how ridicolous “Last Click” attribution is, imagine to be proposing to your significant other, and if it would be reasonable to believe that the engagement ring is the sole contributor to their positive response.
Fortunately statisticians have plenty of tricks up their sleeves and many experimental designs, dating back few centuries, can come to the rescue.
Experimentation and Measurements
As stated above, the problem of measuring incrementality is precisely the problem of Correlation vs. Causation: we want to identify the purchases that we caused, not to correlate our ads with the user’s propensity to buy.
The main challenge is to untangle the targeting from the user’s actions as much as possible, which is not always easy in these complex settings.
Experimentation is the best tool to accurately measure causality while controlling for most known factors.
The design of the experiment will depend on the nature of the advertising platform: below the most popular options.
Intent To Treat (ITT)
The first method I’m going to describe is a very old technique from the world of Clinical Trials, and it’s one of the methodologies used in Facebook’s Conversion Lift Study tool.
When trying to ascertain the effect of a targeting algorithm we can’t compare the audience selected by the algorithm with a fixed control. This would reward cherry picking: if the algorithm was trained to select organic converters (i.e. users that were going to purchase anyway) we would over-estimate the performance of the algorithm, confusing organic behavior (correlation) with incremental effect (causation).
Intent-To-Treat (ITT) is a technique to analyze experiments in which there is one-sided non-compliance, i.e. when some subjects in the treatment group do not receive the treatment. Excluding the Non-Takers from the analysis would result in selection bias but ignoring the problem and pretending all subjects in the treatment groups are equal would underestimate the effect or just measure something different (i.e. the effect of being assigned to the treatment group and not the effect of the treatment itself).
The ITT principle can be summarized by “once randomized, always analyzed”. ICH states “The intention-to-treat […] principle implies that the primary analysis should include all randomised subjects. Compliance with this principle would necessitate complete follow-up of all randomised subjects for study outcomes. In practice this ideal may be difficult to achieve […]”. The reason for the recommendation is due to the fact that an ITT analysis will give a robust estimate even when the data missingness (non-compliance) was not completely random. This would cover the clinical case of more/less severe patients not complying with the therapy, or, in our marketing case, of users being cherry-picked by an algorithm.
In general, when trying to measure absolute incrementality (or lift) we can ask the following questions:
- How many extra sales are caused by trying to show an ad to 100 people.
- How many extra sales are caused by 100 people seeing the ad.
Not only ITT is not influenced from the lack of compliance and measures what is actionable (option 1), but, under few assumptions, it allows us to measure both.
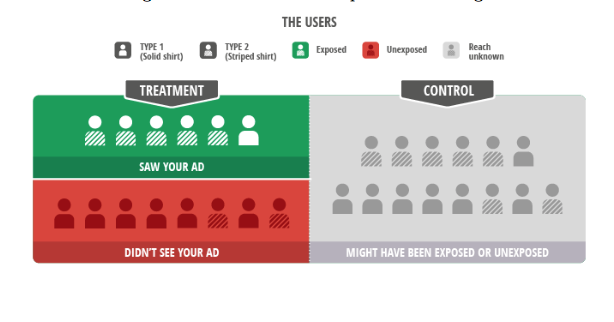
The above picture explains the setting quite clearly. Striped shirts represent high intent users which are bound to convert organically. In the toy example:
- The treatment is neutral. The probability of converting after being exposed is the same of the organic rate, 50%
- Reach (i.e. % of treatment users who get the treatment) is at 42%
- The algorithm targets high intent users which are bound to convert anyway, hence 83% of the users in the treatment convert.
- Due to the biased targeting only 25% of the Never-Takers (i.e. users in the treatment group who do not get treated) convert.
- If we were to analyze this not in an ITT fashion we would be concluging that the incremental conversion rate is 33%
Facebook’s Lift test tools uses an ITT analysis to measure incrementality. Since the targeting algorithm optimises for people more likely to convert, it would be hard to identify a comparable control (it would actually be extremely easy but it would require a change in the targeting algorithm similar to Google’s Ghost Ads.)
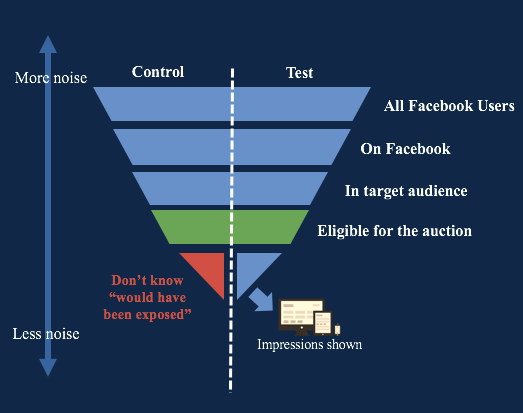
The split between treatment and control happens at a “Universe” level (i.e. all users in an audience eligible for an auction) and then the ad is shown to a subset of people in the treatment group. Eligibility for auction is logged for both Holdout and Test Group, and so is the impression, but the subset of control users that would have been exposed to the ad is not logged (red triangle in the plot below).
ITT designs are easy to implement and with some easy math we can go from “How many extra sales are caused by trying to show an ad to 100 people” to “How many extra sales are caused by 100 people seeing the ad”. The latter is equal to the first scaled (divided) by the reach.
The drawback of ths design is that a low reach waters down the signal considerably, so reach needs to be considered in power calculations.
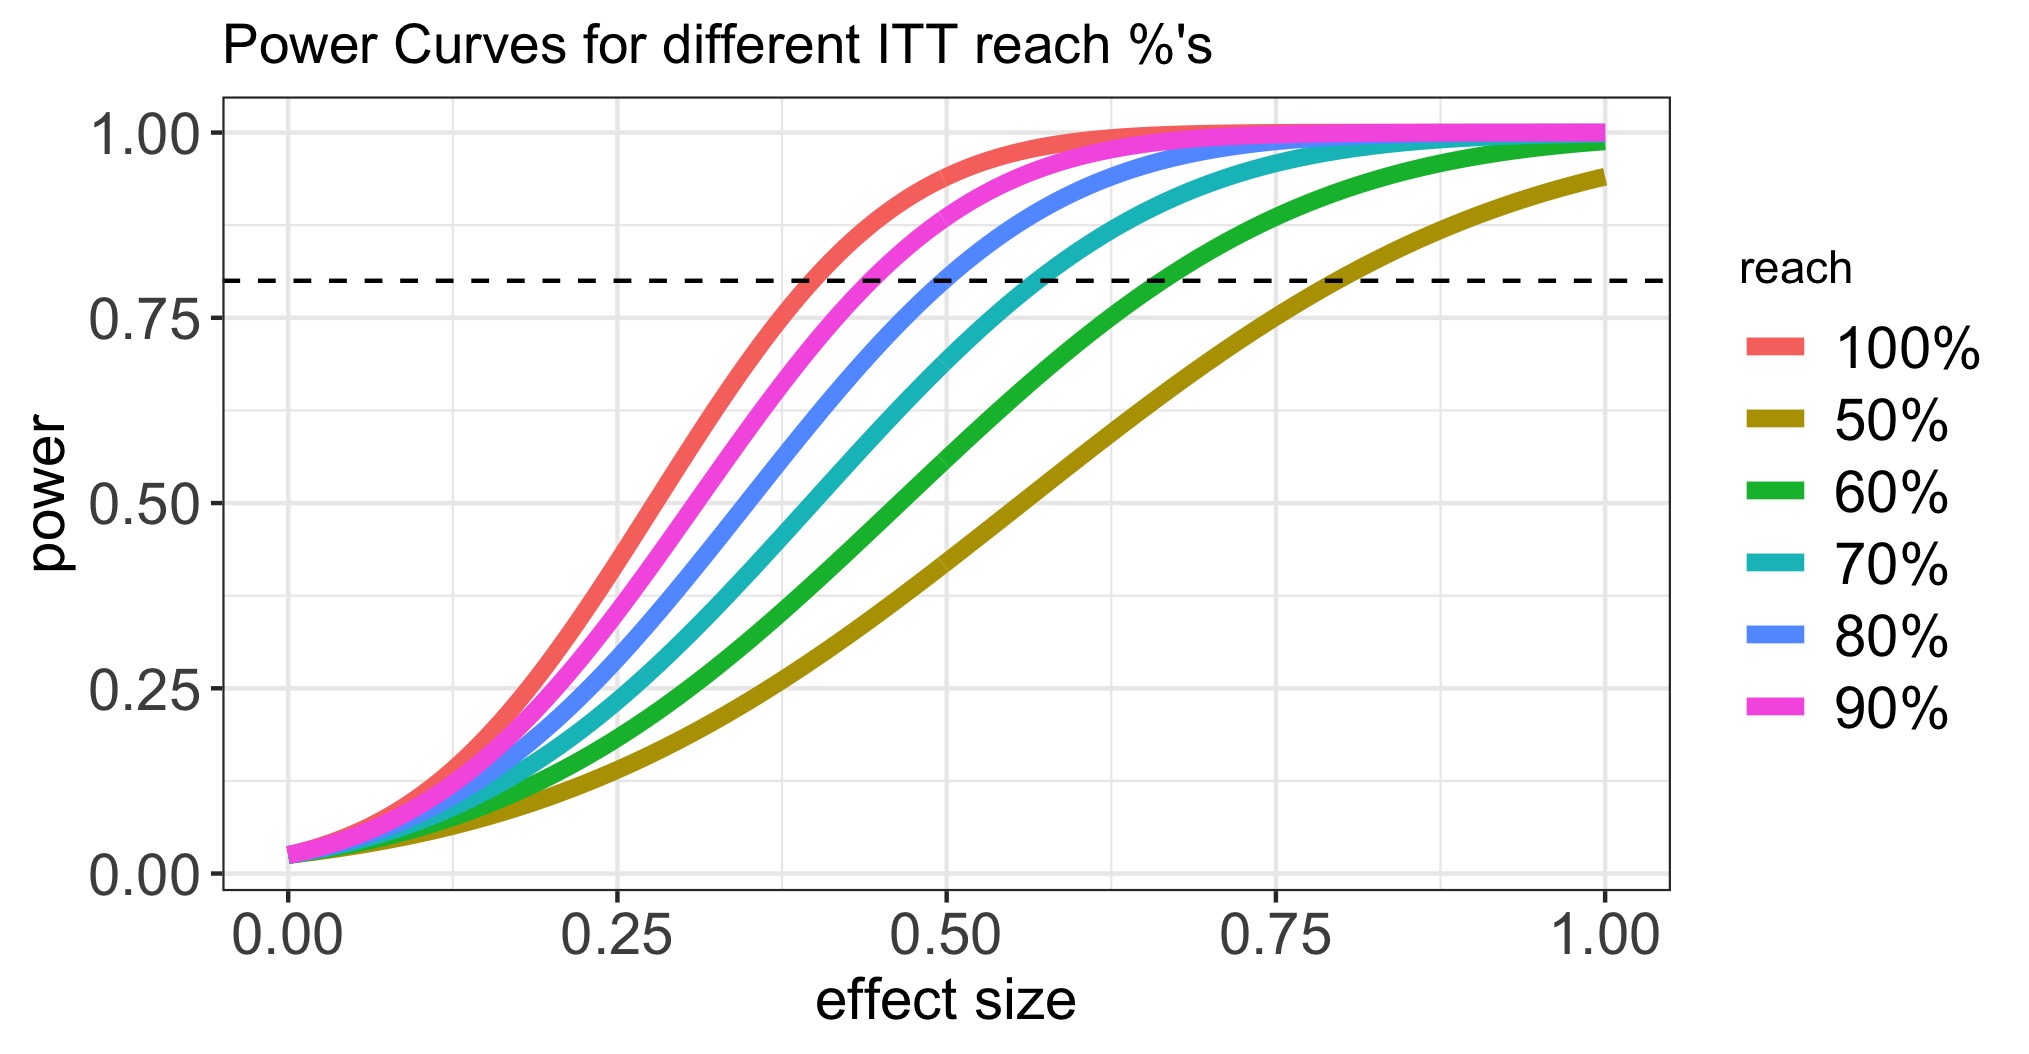
As a consequence of this fact, ITT is poorly suited to broad reach campaigns: such initiatives assume reaching few promising individuals within a wide audience, so they are intrinsically designed for a low reach and end up being underpowered.
In the next section we’ll describe another design that can address this ssue.
“Ghost” Ads
As conveyed in the previous section, when the targeting algorithm optimizes the selection of who is served the ad it becomes hard to identify the appropriate control.
ITT design compare groups at the assignment level, but this has limitation since the estimation can have a high level of uncertainty when reach percentage is low in the treatment group, which can result in a watering down of the signal.
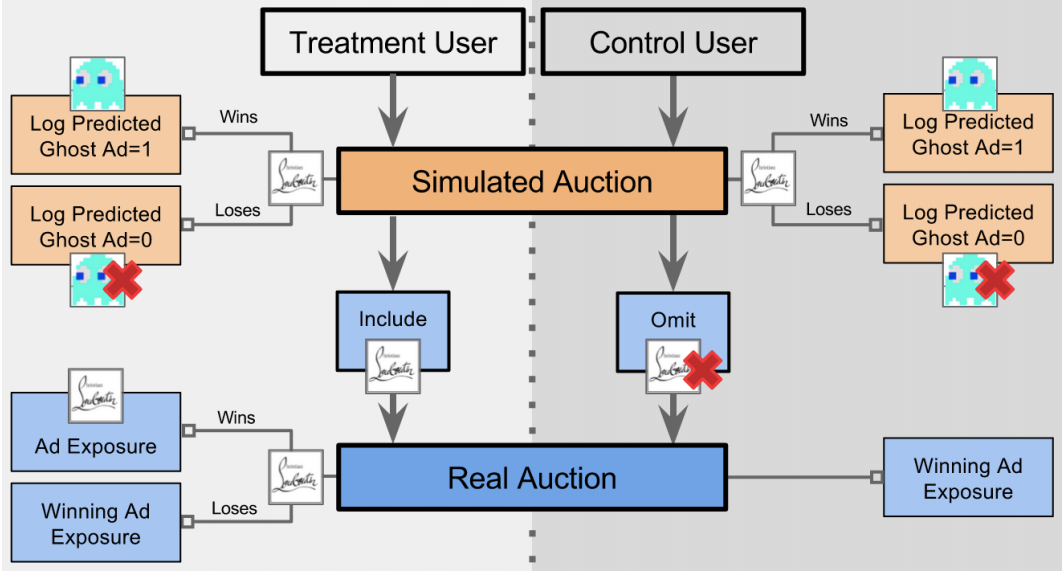
Another popular solution to this problem are Predictive Ghost Ads. This approach, first developed by Google to accurately measure their display ads, consist in using the same algorithm used for targeting to identify the users in the control group that “would have been served” the ad and use them as a comparable group to those in the treatment group who are actually served the ad.
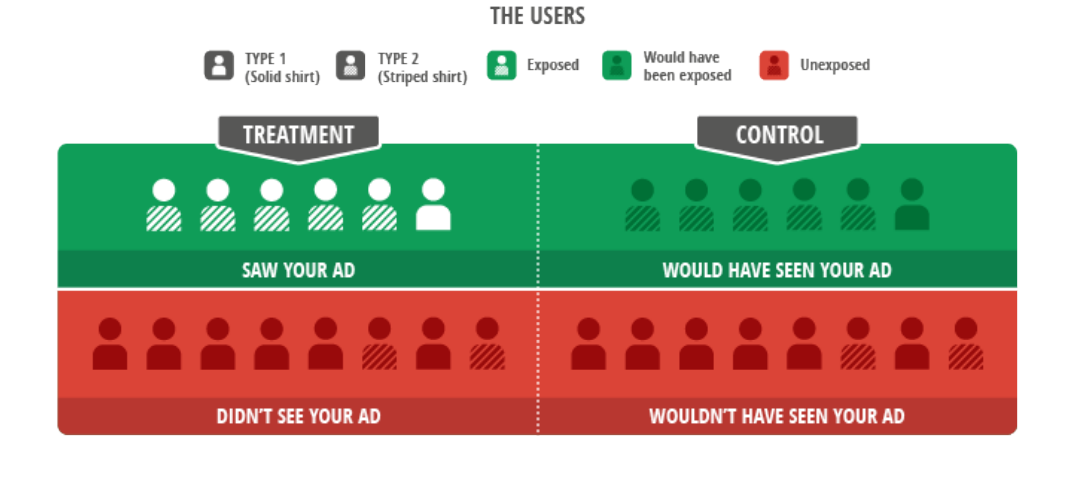
This is an ideal setting since we would be using the same criterion to select the treatment and the control group, however, this can be complicated and hard to implement, specially in more sophisticated ad targeting systems,
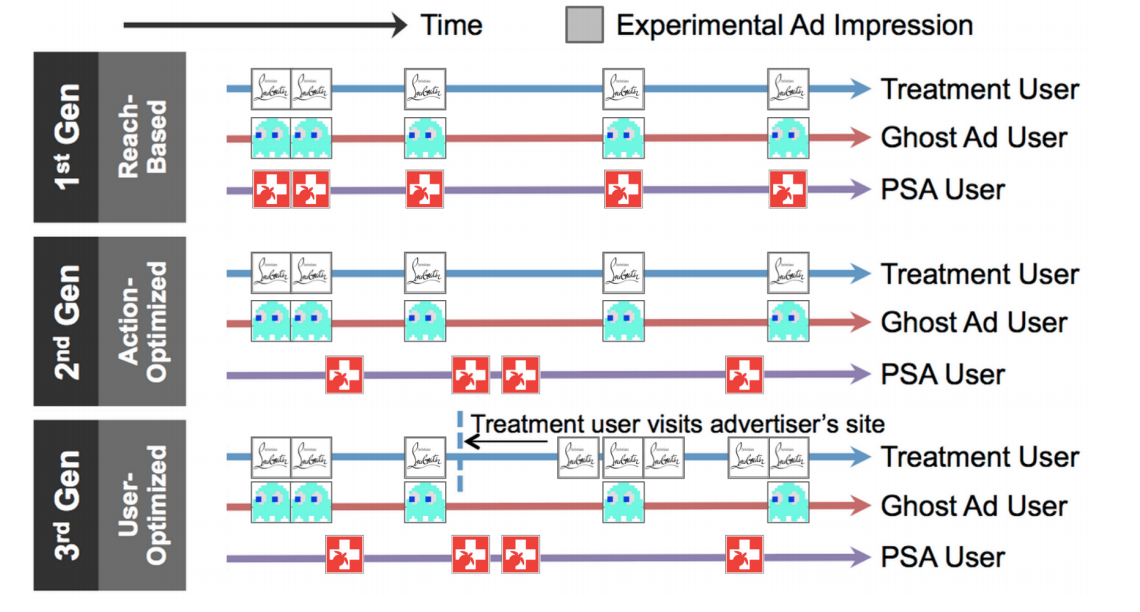
In 3rd Generation systems the optimizer will be using features extracted from the site visits and will learn more about the users in the treatment group, potentially introducing bias since the same learning will not be possible for users in the control group. The control group would end up being representative of those users targeted for a first touch, but any information from their reaction to their first ad would only be available in the treatment group, introducing potential bias. 2nd Generations systems, however, are using only user features and hence manintain the two groups as homogeneous as possible.
GDN targeting algorithm falls within the 2nd Gen family and it can easily exploit the Ghost Ads framework. Facebook’s targeting, however, is more advanced, which is why it has to rely on some form of ITT.
This is extremely hard to implement, but reducing opportunity logging to the first touch would be a good compromise to increase reach in an hybrid Ghost-ITT design.
“Split” testing
Of course even in this setting classic AB tests have their use. Split tests are experiments designed to measure the relative incrementality of some feature of a campaign. While Absolute Incrementality is the causal effect of serving the ad, Relative Incrementality is the added value of a version of the ad over another.
This tool is useful to iterate quickly over copy changes, images, design, etc. while such tests are easy to power, it may be hard to measure immediate changes (due to the delay in purchases).
Geo-Level Experimentation
All these techniques assume a high level of control in the administration of the ads. This is why they are embedded in the echosystem of the vendor (Facebook, Google, etc.). Their success is based on the individual targeting that ensures no spill over and separation between treatment arms.
There is, however, a wide range of advertising channels that can not grant such level of control. Examples include:
- Radio/TV/Out Of Home (OOH) advertising
- Long term impact (even with current tools is challenging to cohort users for long periods of time)
Since we can’t control assignment on an individual unit, in such cases we assign our spend based on location. Since a user can only be in a certain geo at a certain time, and depending on their mobility, we can control who is targeted by a certain campaign and who isn’t.
This can be achieved by selecting a few cities, States, or Designated Market Area (DMA) to be targeted and leaving a few others quiet as controls. This is clearly a large scale operation that implies internal coordination and makes a tradeoff between a loss in sales due to the control areas and the understanding of the ROAS.
I will not go in depth here on how these type of experiments can be analyzed. Techniques like Differences in Differences (very similar to Google’s Time Based Regression) are easy to mplement but often unreliable. Synthetic Control (such as Google’s Causal Impact package) type of techniques are more flexible and allow for higher power and stronger inference.
Data Centric Approach
This post gave a bird’s eye view of Marketing Measurement and described few important techniques.
There are other areas which I didn’t cover, but are equally important. Efforts like building a reliable bottom up Multi Touch Attribution model (MTA aka the Holy Grail of digital marketing) or a Mixed Media Model (MMM, top down approach to deciding where to spend the next marketing dollar).
The key to build a data driven Digital Marketing Team is to fosted data culture. As much as Data Scientists have a deep understanding of measurement techniques, are the marketers who have the best sense for the data and can be empowered to scale the measurement effort when granted access and training. More eyes on the data will also help data quality, since outages will be reported earlier.
Allowing marketers to run their campaigns as experiments and empowering them with the understanding of statistical testing will allow for better hypothesis to be tested, to fail faster and adopt new learnings.
This can be ultimately summarized in a “Measure it or don’t do it at all” culture, in which dollars are spent only when the return of investment is measurable, which can be achieved only through a democratization of measurement tools.
Glossary
- DMA = Designated Market Area
- SEM = Search Engine Marketing. Sponsored ads at the top of a Search Engine search.
- SEO = Search Engine Optimization.
- ROAS = Return Of Ad Spend
- MTA = Multi Touch Attribution.
- MMM = Mixed Media Model.
- ITT = Intent To Treat
- ATE = Average Treatment Effect